Denied claims quietly drain revenue, and most practices notice the damage only after cash flow drops. Your denial rate shows how much revenue sits in rework and appeals each month. Many teams calculate it incorrectly, which hides the real problem. This post gives you the formulas, payer benchmarks, and a method to lower your number.
You will also see the average health insurance denial rate from KFF data. Aetna, Cigna, and Blue Cross Blue Shield results are compared against that benchmark.

What Denial Rate Means in Medical Billing?
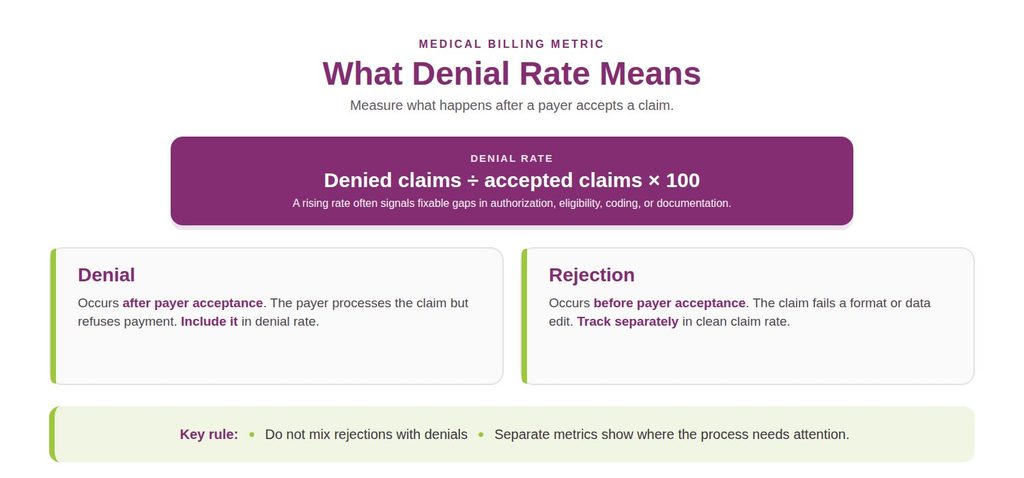
Denial rate is the percentage of submitted claims that a payer refuses to pay after accepting them for processing. It measures how often your billing process fails to meet payer rules on the first attempt. A rising rate usually points to a fixable cause, such as missing authorizations or eligibility gaps.
A denial is not the same as a rejection, and mixing them distorts your numbers. A rejection happens before the payer accepts the claim, usually because of a format or data error. A denial happens after acceptance, and only denials belong in your denial rate. Track rejections separately, using a clean claim rate that shows how often claims pass edits.
What is the Denial Rate Formula?
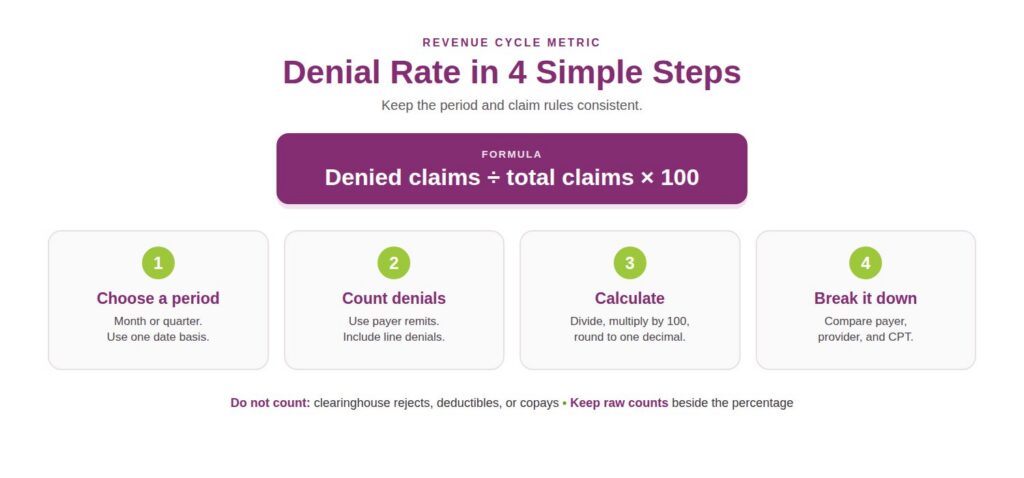
The standard formula divides denied claims by total claims submitted, then multiplies by 100. You can apply it to any period, payer, provider, or CPT code. Accuracy depends on a clean denominator, so count every claim that reached a payer once each. Resubmitted claims are not new claims and should not inflate your total volume.
Denial Rate (%) = (Denied Claims ÷ Total Claims Submitted) × 100
Suppose a gastroenterology practice submits 1,000 claims in March and payers deny 120. Divide 120 by 1,000 to get 0.12, then multiply that result by 100. The denial rate is 12%, which means about one in eight claims needs rework. Each reworked claim consumes staff time and often delays payment by several weeks.
Denial Rate by Dollar Value
The dollar method divides denied charges by total submitted charges, then multiplies by 100. Use it when a few high-value claims drive your losses, such as surgeries or infusions. A practice can show a low count rate and still have a high dollar rate. Always report both numbers side by side so leadership sees the full picture.
Dollar Denial Rate (%) = (Denied Charges ÷ Total Submitted Charges) × 100
First Pass Denial Rate Versus Final Denial Rate
First pass denial rate counts claims denied on the initial submission, before any appeal or correction. Final denial rate counts only claims that stay unpaid after all appeals and resubmissions. The first pass number measures front-end quality, while the final number measures recovery. Together they show whether your biggest problem is prevention or follow-up work.
First Pass Denial Rate (%) = (Claims Denied on First Submission ÷ Total Claims Submitted) × 100
Final Denial Rate (%) = (Claims Unpaid After All Appeals ÷ Total Claims Submitted) × 100
How to Calculate Denial Rate Step by Step
The following are the steps to calculate denial rate for your practice:
Step 1: Pick a Period and Count Claims
Choose a month or a quarter and keep the same window every time. Base it on either the date of service or the submission date, but never mix both. Pull every claim sent to payers in that window on the CMS-1500 or UB-04. Count each claim once, and exclude clearinghouse rejections that never reached the payer.
Step 2: Count Denied Claims
Use the 835 electronic remittance advice from each payer to find your denied claims. Look for claims where the payer paid $0 and listed a claim adjustment reason code, called a CARC. Some claims pay partly and deny certain service lines, so review line-level adjustments too. Do not count patient responsibility amounts, such as deductibles or copays, as denials.
Step 3: Divide and Multiply
Divide denied claims by total claims, then multiply by 100 and round to one decimal place. Record the raw counts beside the percentage, because a move from 8.0% to 8.5% means little on 100 claims.
Step 4: Repeat by Payer, Specialty, and CPT Code
A single practice-wide number often hides the payers and codes causing the real problem. Run the same formula for each payer, each provider, and each high-volume CPT code. A colonoscopy code like 45378 may be denied at a very different rate than 99214. Split the data first, then set separate goals for your worst payers.
Worked Example
Here is a sample month for a practice with 1,000 claims across three payers. The table shows how a healthy-looking overall rate can hide one weak payer. Payer A deserves the first audit because it combines the highest rate with a large claim volume. Payer B shows what a well-managed account looks like when front-end checks work.
| Payer | Claims Submitted | Claims Denied | Denial Rate |
|---|---|---|---|
| Payer A | 400 | 60 | 15.0% |
| Payer B | 350 | 28 | 8.0% |
| Payer C | 250 | 32 | 12.8% |
| Total | 1,000 | 120 | 12.0% |
After appeals, the practice recovered payment on 70 of the 120 denied claims. That leaves 50 unpaid claims, so the final denial rate is 5%. The first pass rate stays at 12% because every denial happened on first submission.
Building this payer-level view takes time, so many practices hand it to a medical billing company. A good report shows claim counts, denied counts, dollar impact, and top CARC codes for each payer. Without those columns, you cannot decide where to focus your appeal hours.
Which Claims to Include and Exclude
Include in the denied count:
- Claims denied in full, with a $0 payment and a CARC explaining the reason.
- Claims with one or more denied service lines, counted once as a partial denial.
Exclude from the denied count:
- Clearinghouse rejections that never reached the payer for adjudication.
- Patient balances from deductibles, copays, and coinsurance that the plan applied correctly.
- Contractual adjustments, which are the normal gap between billed charges and the allowed amount.
- Duplicate submissions of the same claim, which inflate both sides of the formula.
Types of Denial Rate Metrics Compared
| Metric | Formula | What It Shows | Best Used For |
|---|---|---|---|
| Claim count denial rate | Denied claims ÷ total claims × 100 | Volume of denials | Monthly performance tracking |
| Dollar denial rate | Denied charges ÷ total charges × 100 | Revenue at risk | Prioritizing costly denials |
| First pass denial rate | First submission denials ÷ total claims × 100 | Front-end quality | Fixing registration and coding errors |
| Final denial rate | Unpaid claims after appeals ÷ total claims × 100 | Write-off risk | Measuring appeal success |
| Appeal overturn rate | Overturned appeals ÷ appeals filed × 100 | Appeal effectiveness | Choosing which denials to fight |
Two more metrics help you decide where to spend appeal time and where to fix the front end. Appeal overturn rate shows how often appeals succeed for each denial type and each payer.
Denial write-off rate shows the denied dollars that you permanently lose. When overturn rates stay low for one CARC code, prevention beats appeals every time.
What is a Good Denial Rate?
Many industry benchmarks place a healthy denial rate between 5% and 10%. Strong teams aim to keep the first pass rate below 5% through careful front-end checks. Treat these numbers as reference points, because no single target fits every practice. Specialty, payer mix, and claim complexity decide what is realistic for you.
| Denial Rate | Meaning | Action |
|---|---|---|
| Below 5% | Strong performance | Maintain and monitor |
| 5% to 10% | Acceptable range | Review top denial reasons |
| 10% to 15% | Revenue leak | Audit by payer and CPT code |
| Above 15% | Serious problem | Fix front-end process now |
Average Health Insurance Denial Rate
The best public data comes from KFF, which analyzes federal transparency reports. These reports cover plans sold through HealthCare.gov, not employer plans or state-run exchanges. KFF found an average health insurance denial rate of 19% for in-network claims in 2023. Out-of-network claims fared worse, with a denial rate of 37% across the same insurers.
KFF’s 2024 data showed the same 19% in-network average, so the problem has not improved. Marketplace consumers appealed fewer than 1% of denied claims in 2023, so most denials go unchallenged. Practices that appeal consistently can recover revenue that others simply write off.
| Parent Company | In-Network Denial Rate (2023) | Points Above 19% Average |
|---|---|---|
| Blue Cross Blue Shield of Alabama | 35% | 16 |
| UnitedHealth Group | 33% | 14 |
| Health Care Service Corp. (BCBS) | 29% | 10 |
| Molina Healthcare | 26% | 7 |
| Elevance Health | 23% | 4 |
| CVS Health/Aetna | 22% | 3 |
| Cigna | 21% | 2 |
| BlueCross BlueShield of Tennessee | 21% | 2 |
Source: KFF analysis of 2023 HealthCare.gov transparency data.
Aetna Claim Denial Rate
Aetna, reported under CVS Health, denied 22% of in-network claims in KFF’s 2023 data. That figure sits three points above the 19% marketplace average for in-network claims. Rates differ by state and plan, so calculate your own Aetna claim denial rate from monthly remittances. Compare your result with 22% to see how your practice performs against the marketplace pattern.
Cigna Claim Denial Rate
Cigna denied 21% of in-network claims in the same 2023 KFF data. KFF also reported that 30% of denial reasons for Cigna HealthCare of North Carolina were medical necessity. If your Cigna denials cluster around medical necessity, review clinical notes and authorization records first. Track your Cigna claim denial rate by CARC code to see which reasons drive the number.
Blue Cross Blue Shield Claim Denial Rate
The Blue Cross Blue Shield claim denial rate varies widely because each BCBS company operates independently. In 2023, BCBS of Alabama denied 35% of in-network claims, the highest among large insurers. Health Care Service Corp., which runs Blue plans in four states, posted 29%. BCBS of Tennessee posted 21%, which is close to the Cigna and Aetna results.
Common Denial Reasons to Track
A rate alone fixes nothing, so group denials by CARC code to find the causes. Pair each CARC with the remark code, called a RARC, when the payer sends one. The RARC often names the missing data field or the document the payer wants.
| CARC | Meaning | Common Cause | Fix |
|---|---|---|---|
| CO-16 | Claim lacks information | Missing or invalid data field | Add scrubber edits before submission |
| CO-50 | Not medically necessary | Diagnosis does not support the service | Match ICD-10 codes to documentation |
| CO-97 | Benefit included in another service | Bundling without the correct modifier | Review NCCI edits and modifier use |
| CO-29 | Timely filing limit expired | Late submission or late correction | Track payer filing limits |
| CO-18 | Duplicate claim | Resubmission without a corrected claim indicator | Check claim status before resubmitting |
| CO-197 | Authorization absent | Prior authorization not obtained or not on file | Verify authorization at scheduling |
Calculate each code’s share of total denials, then rank codes by denied dollars. If CO-197 causes 30 of your 120 denials, that one issue drives 25% of the volume. If those 30 claims average $900, you have $27,000 at risk from one fixable gap. Dollar ranking stops you from chasing frequent but low-value denials first.
Bundling denials under CO-97 deserve extra attention because they repeat every month. Billing 99214 with a procedure like 11102 without modifier 25 often triggers CO-97. Add modifier 25 only when documentation supports a separate and significant evaluation. Coders should also review NCCI edits and modifier 59 or XS rules before submission.
How to Lower Your Denial Rate
Here is how to lower your denial rate:
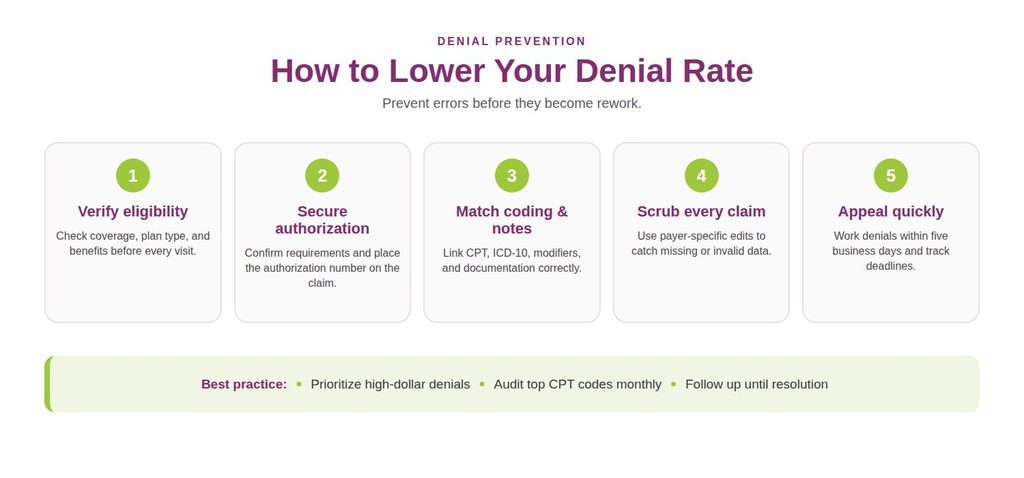
Verify Eligibility Before Every Visit
Check coverage, plan type, and benefits at scheduling and again on the date of service. Run real-time eligibility checks through the 270 and 271 transactions before each visit.
Secure Prior Authorization
Build a payer-specific list of CPT codes that require authorization, and update it every quarter. Oncology infusions, advanced imaging, and neurology procedures often need approval before the visit. Attach the authorization number to the claim, because an approval is useless if the claim omits it.
Tighten Coding and Documentation
Coders should match each CPT code to a supported ICD-10 diagnosis and the correct modifier. Medical necessity denials under CO-50 often come from a diagnosis that does not support the service. Run a monthly audit on your top ten CPT codes by volume.
Scrub Claims Before Submission
Use a claim scrubber with payer-specific edits to catch errors before they reach the payer. Complete RCM services connect eligibility, coding, and claim scrubbing, so errors get caught at the source. That structure also reduces CO-16 denials, which come from missing or invalid data.
Appeal and Follow Up Fast
Set a standard turnaround for every denial, ideally within five business days of the remittance. Track each payer’s appeal deadline, since deadlines vary by payer and contract. Prioritize appeals by denied dollars and by the odds that the payer will overturn. Dedicated denial management services track every appeal deadline and follow up with payers until resolution.
What Are the Common Mistakes When Calculating Denial Rate
- Mixing rejections and denials in one count inflates your rate and hides your true clean claim performance.
- Using different time windows for the numerator and denominator produces a misleading percentage.
- Counting a resubmitted claim as a new claim inflates your total volume and lowers the rate falsely.
- Tracking only the practice-wide rate hides the payers and codes that cause most of the loss.
- Judging a payer’s rate on very few claims leads to false alarms, so wait for a larger sample.
Request first pass and final rates separately from any medical billing services you use. Ask how the vendor defines a denial and whether partial denials are included. Vendors who report a single blended figure may be hiding weak first pass performance behind strong appeal results. Clear definitions also let you compare one vendor against another on equal terms.
Frequently Asked Questions
What is the Formula For Denial Rate in Medical Billing?
Divide the number of denied claims by total claims submitted, then multiply by 100. Use the same period for both numbers and count each claim once.
What is the Average Health Insurance Denial Rate?
KFF reported an average in-network denial rate of 19% for HealthCare.gov plans in 2023 and again in 2024. Out-of-network claims were denied far more often, at 37% in 2023 across the same insurers.
Is the Aetna Claim Denial Rate Higher Than the Cigna Claim Denial Rate?
In KFF’s 2023 data, Aetna posted 22%, and Cigna posted 21%, so the gap is small. Your own remittance data matters more than either national figure for planning fixes.
Which Blue Cross Blue Shield Plan Has the Highest Denial Rate?
In 2023, BCBS of Alabama had the highest rate among large insurers at 35%. Each Blue company reports its own data, so check the plans in your payer mix.
What is the Difference Between a Denial and a Rejection?
A rejection stops at the clearinghouse or payer front end, while a denial follows claim acceptance. Only denials count toward your denial rate, while rejections feed a clean claim rate.
How Often Should I Calculate Denial Rate?
Calculate it monthly at minimum, and review payer-level numbers weekly if your rate exceeds 10%. Weekly review catches payer policy changes before they cost you a full month of revenue.
Should I Include Partially Denied Claims?
Count a claim as denied if any service line is denied, and keep that rule consistent. Also track partial denials separately if they make up a large share of your total.